Single-Molecule Spectroscopy
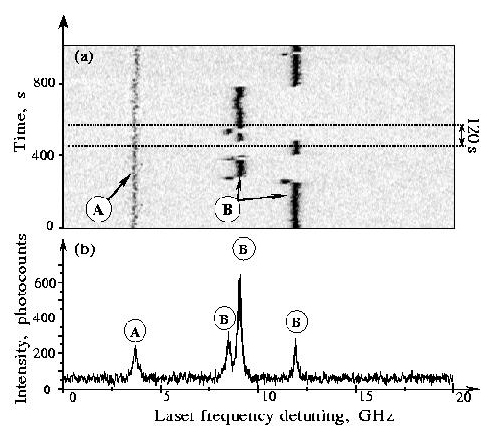
Series of repeated fast scans (8 seconds each) over a spectral region with two single-molecule lines A and B (top) and sum spectrum during the 120-second interval indicated (bottom). Substituted terrylene (TBT) in polyisobutylene.
Single-Molecule Spectroscopy at Low Temperatures
Single fluorescing dopant molecules in a solid can be used as probes to obtain information about their local environment. To this end, the fluorescence signal of the molecule is measured as a function of some external parameter, e. g., the time, hydrostatic pressure, electric or magnetic fields. For example, shifts or jumps of the absorption frequency reflect relaxation processes or rearrangements in the solid matrix; line shifts in an electric field yield information about electric matrix fields at the location of the molecule.
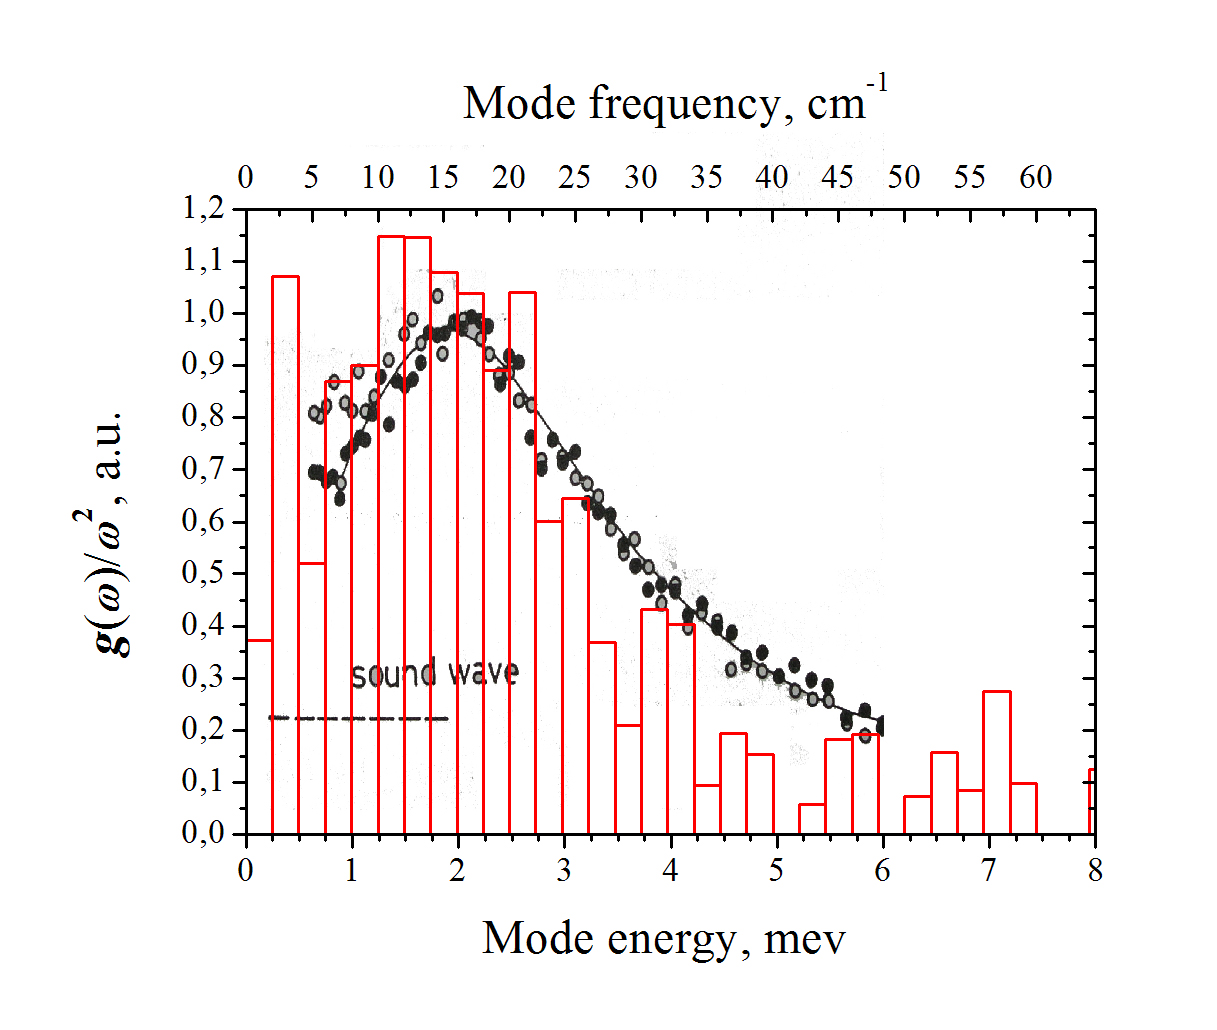
Histogram, distribution of the quasi-local-mode frequencies as measured by single-molecule spectroscopy of TBT in polyisobutylene; circles, literature data of the Boson peak spectrum as measured in pure polyisobutylene with inelastic neutron scattering (R. Inoue et al., J. Chem. Phys. 95, 5332 (1991)).
At very low temperatures below about 5 K, the linewidth of single-molecule spectra in disordered matrices is also determined by tunneling processes (spectral diffusion), at slightly higher temperatures by the coupling to quasi-local vibrational modes which are inherent to amorphous solids and have their origin in the disordered structure. It was found that in many materials the distribution of their frequencies coincides with the so-called Boson peak, an excess vibrational density (with respect to the Debye spectrum) which can be measured, e. g., by inelastic neutron scattering.
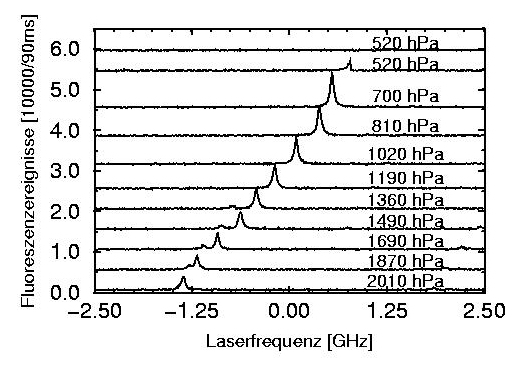
Line shift of a single molecule with external hydrostatic pressure. Pentacene in p-terphenyl.
An important feature of single-molecule spectroscopy is the complete absence of ensemble-averaging effects. The experiments are performed in a helium cryostat, because high spectral sensitivity requires low temperatures (typically below 4 K).
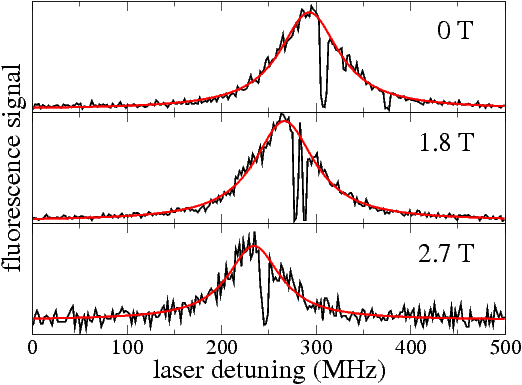
Spectrum of a single terrylene molecule in n-hexadecane at three different magnetic flux densities. The Zeeman shift is quadratic in the flux density with a shift parameter of -8 MHz/T2. The short dark periods are caused by flips of a nearby two-level system of the matrix.
The light from a single-mode scanning dye laser is focussed onto the sample with a microscope objective (also located in the cryostat), and the red-shifted fluorescence is collected with the same objective in backward direction. This is a similar optical principle as used for Confocal Raman and Luminescence Microscopy at Room Temperature.
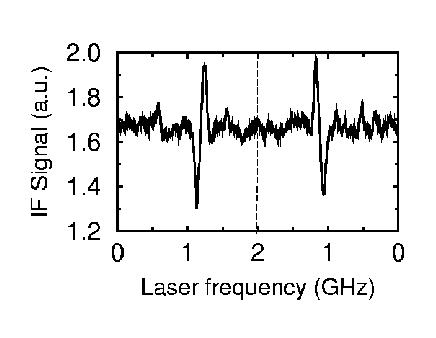
Absorption signal of a single molecule as recorded with radio-frequency Stark effect modulation. Terrylene in n-hexadecane.
With rf Stark effect modulation in the MHz range, which suppresses low-frequency technical laser noise, it is also possible to record absorption signals of single molecules. Some materials, which were investigated recently, include organic crystals (p-terphenyl), Shpol'skiĭ matrices n-hexane, n-hexadecane), and polymers (polyethylene, polyisobutylene), but also low-molecular glass formers such as toluene. Typical chromophores are polyaromatic hydrocarbons and their derivatives (pentacene, terrylene) which are characterized by high fluorescence quantum yield and weak electron-phonon coupling.
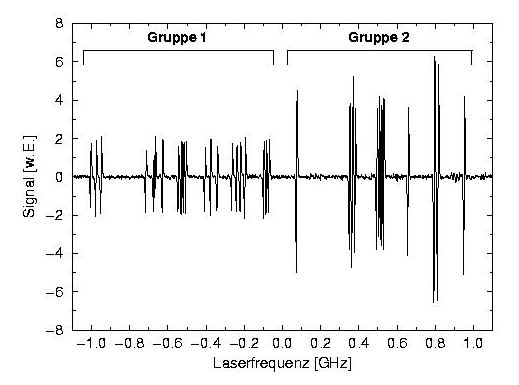
Doppler-free absorption lines of iodine vapor.
Small line shifts of single molecules can be measured with very high sensitivity. Errors due to laser frequency drift are detected and eliminated by measuring the absorption signals of iodine vapor. They provide optical frequency markers, whose positions are stable and reproducible to better than 1 GHz. Also doppler-free recording of the iodine lines is possible, which provides an even higher accuracy.
